My Data Driven Instruction Nightmare
Thursday morning, and it was cold. The day, designated for professional development. It was my first year at a high performing, “no excuses” charter school. The results were in from our first benchmark exam of the year. I sat, a little uneasy, knowing that my colleagues and I we were being judged by the scores. We reviewed the data as a group and found out how our students were performing as compared with other students within the school and the network. Immediate improvement was required, and the pressure was on. It felt like more of a competition than a cooperation. Our school leader gave an amazing speech about how we were going to use the data to target the areas of our students’ weakness. It was a great pep talk, and I got fired up!
 Data driven, and alone in my classroom

I went by myself to my classroom, with a password to access the data from my students. I opened the portal and it overwhelmed me. Each standard was listed, in complicated colors. First, I had to determine how my three sections performed on all the standards as a whole. Then, I had to look at what standards more than 30% of each group struggled with. After three hours of doing this with no support, just figuring it out on my own, I had an epiphany. Albeit bittersweet. Sweet because I knew how I was going to get the most out of the data I had just received (even though it was poorly presented to me and tedious to navigate). And bitter because it meant I still had hours and hours of work to do, before I could get back to planning creative and engaging lessons, grading assessments, and creating my materials. I began to break down each question and find the common errors, I would go back to the benchmark exam and see what distractor answers the students chose, and slowly I began to make sense of the data. Gradually, patterns began to emerge.
 Untangling the benchmark assessment
Getting the data from the previous three months was helpful. But it meant I had to restructure future units, to include ways to circle back and reteach what the benchmark data had shown me. I reworked my semester pacing (not to be confused with classroom pacing), extracurricular time was replaced with test prep. I reworked my units, I retaught the areas that needed to be addressed. It was miserable. I could feel my joy and enthusiasm waning. The kids could feel it too! They could sense that I was feeling tense and under pressure, and they also struggled with the weight of it all. No one was very happy, but we all did it together. And you know what? Their scores improved that year, and I survived. And I became consumed with one question. How could I get relevant data without depleting the joy, engagement, and enthusiasm that I work so hard to create in my class?

The aha moment
I realized I needed to have a better grasp of what the students mastered the same day that I taught it. I needed to get more out of the formative assessment strategies I was already using. The results from my informal assessments for learning were what I had to have, not outdated benchmark data. Instead of reviewing my daily exit tickets, and anecdotally tracking my creative checks for understanding, I needed to track them closely. I found that this was the best way to stay up to date in real time with my student performance.
Again, I met with a brick wall! I had over ninety students! Doing item analysis on 90 exit tickets a day was unsustainable. I needed a better way for myself and teachers just like me in under-resourced schools.
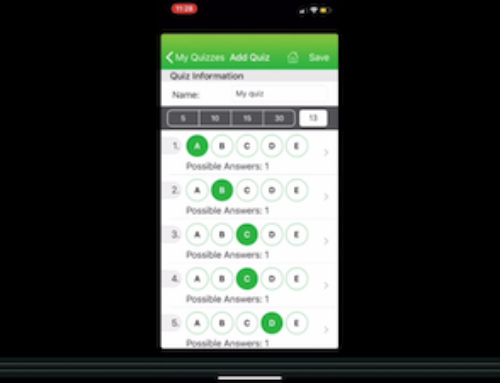
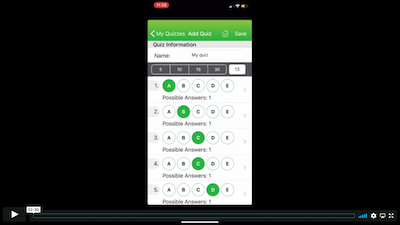
The most powerful data comes from daily assessment for learning. Research has proven that using it for meaningful feedback, student goal setting, and to inform instruction increases student performance. I created Quick Key in order to make this process sustainable and easy in any classroom, paper or paperless. Learn more at get.quickkeyapp.com, or sign up for free with the button below.


